Fault reports gets generated either by sensors installed in the office or by the employees using the NhanceTwin app.

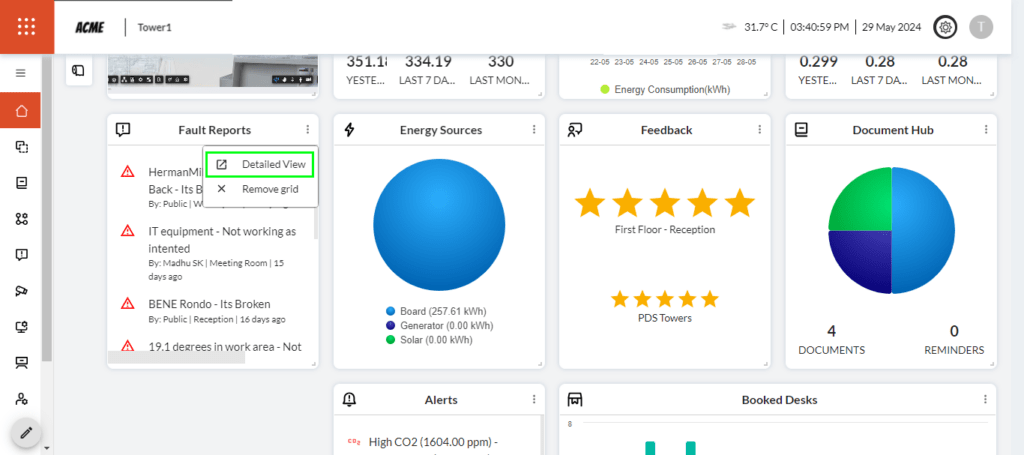
Fault Reports can be accessed by clicking the ‘detailed view’ button on the card (marked in green) on the dashboard.

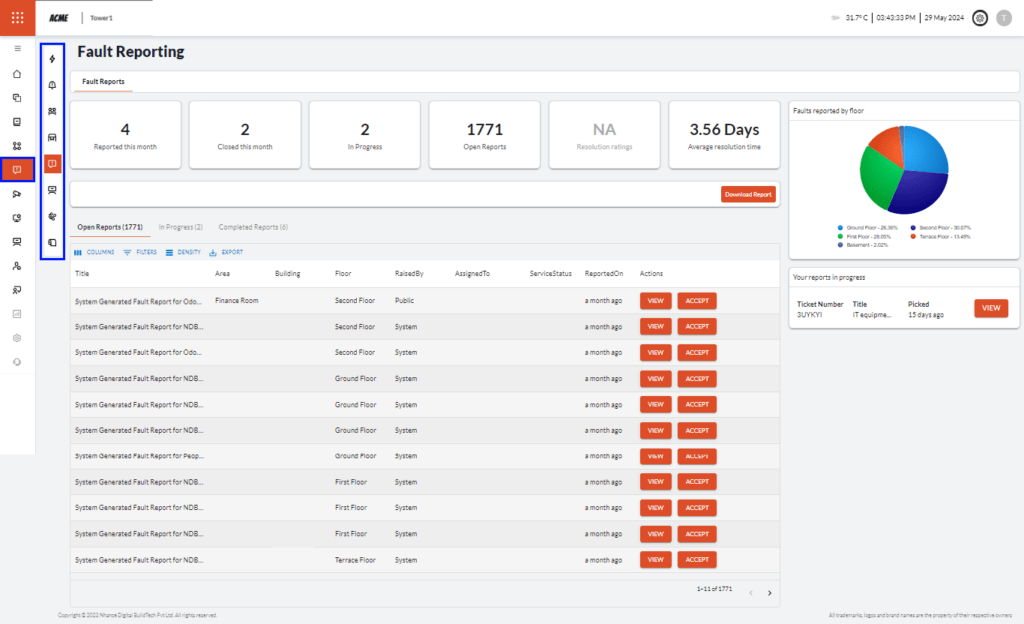
Fault Reports can also be accessed by clicking on the icon in the main menu and sub-menu (marked in blue) on the dashboard.

The ‘Overview’ area will showcase the following information:

  1. Displays Reported this month, Closed this month, In Progress, Open Reports, and Average resolution time at the beginning of the screen.
  2. Click on the ‘Download Report’ button to download the report in either PDF or Excel format. For more information on downloading a report, please refer to this page.
  3. Faults reported by floor: A graph is also provided to indicate the floorwise percentage of Fault Reports. Click on the individual floor name shown in the legend to deselect and to see the required floor information only.
  4. A filter has also been provided to sort the Fault Reports.
  5. Individual Fault Reports are displayed below with clear bifurcation according to the categories. It also shows the location of the office, reported by the type of sensor and time, raised by, assigned to, and service status of the fault.
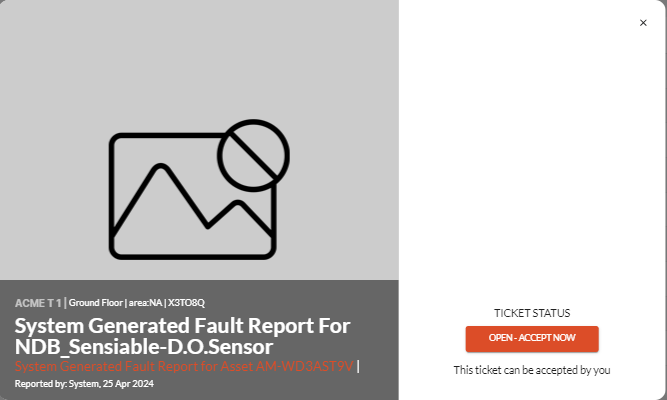
  6. An individual alert can viewed by clicking on the ‘View’ button which is given at the end of each alert. Also, the facility manager or the system administrator can resolve the issue by accepting it by clicking on the ‘Accept’ button. After clicking on the ‘Accept’ button a pop-up opens, see image below.

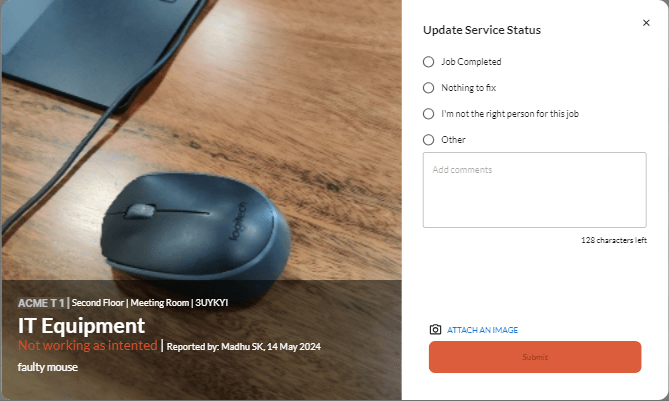
Your reports in progress: Allows you to view and update the service status of the administrator or facility manager. After clicking on the ‘View’ button a pop-up opens, see image below. Al

Visited 12 times, 1 visit(s) today

Comments are closed.

Close Search Window