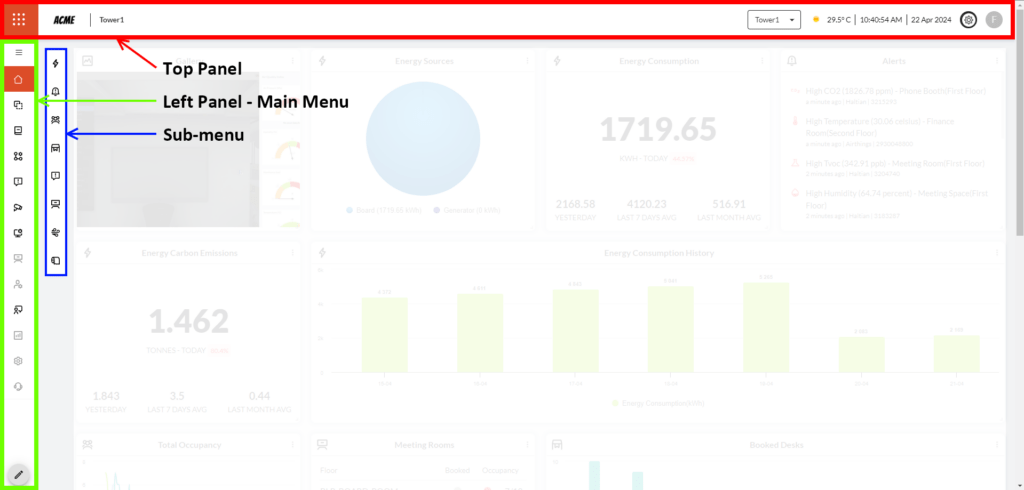
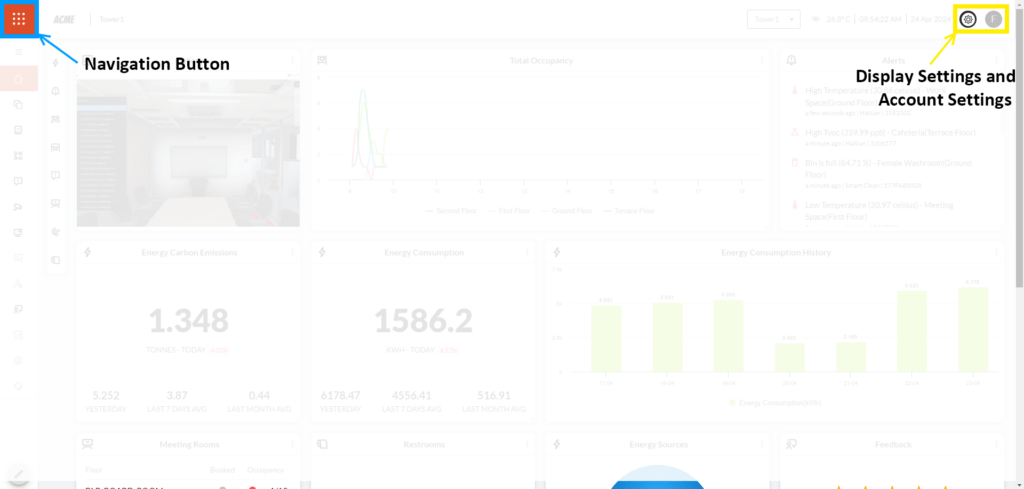
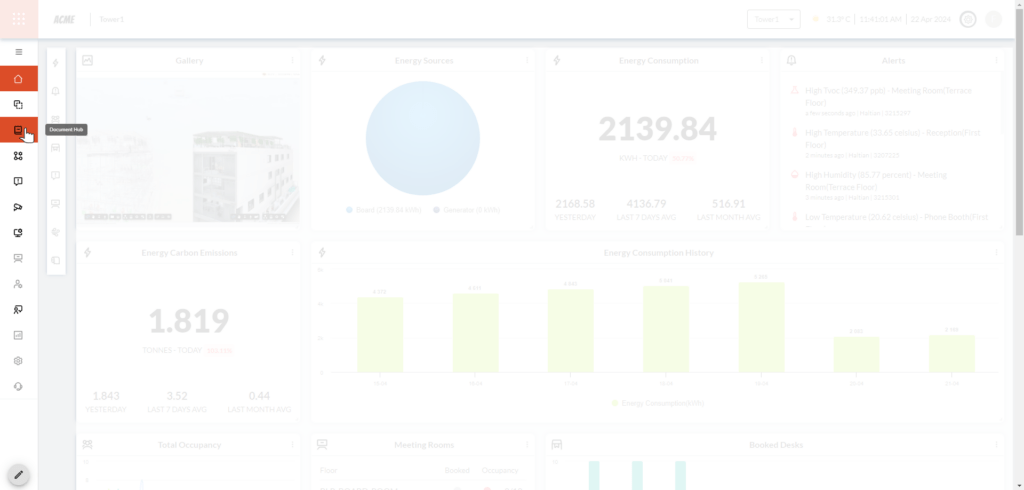
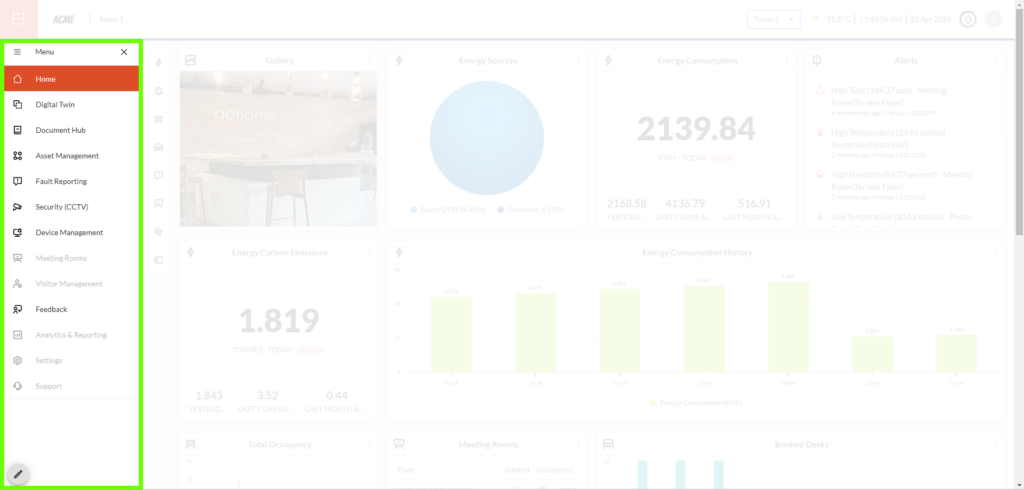
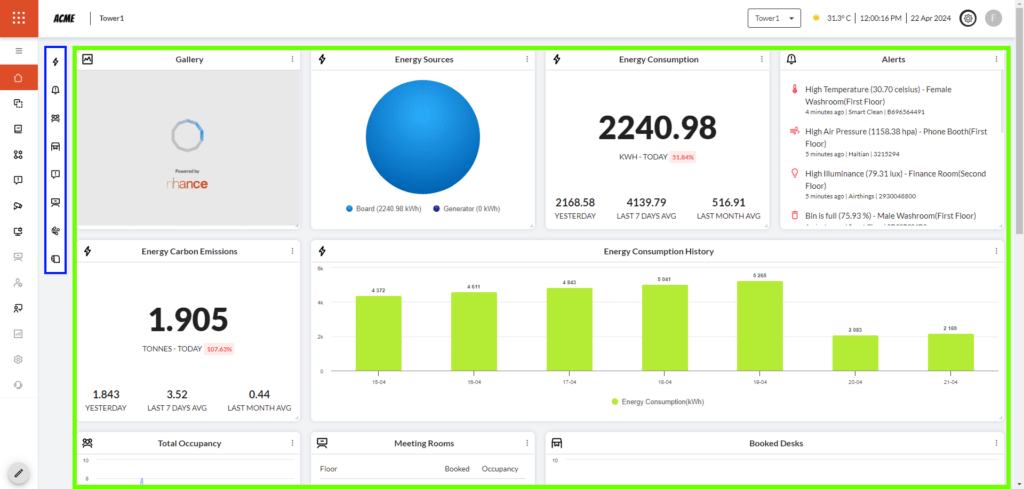
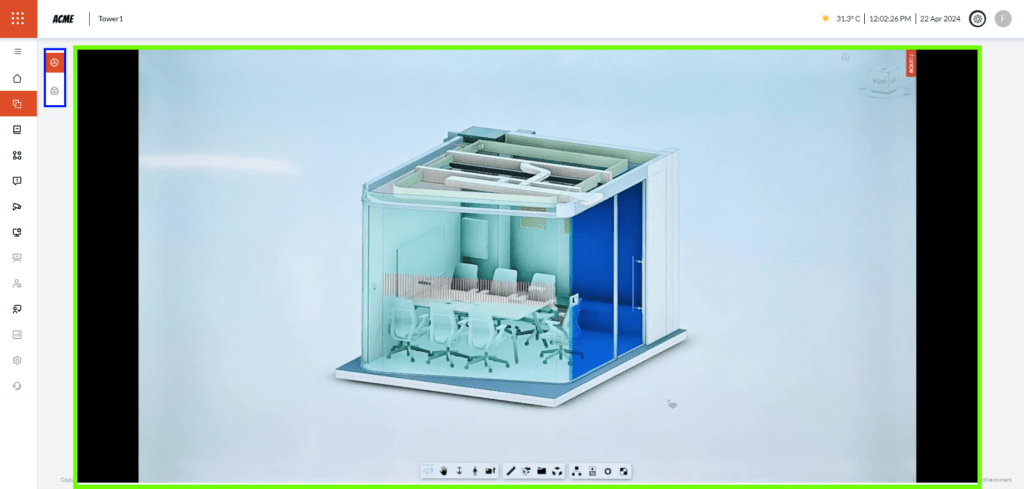
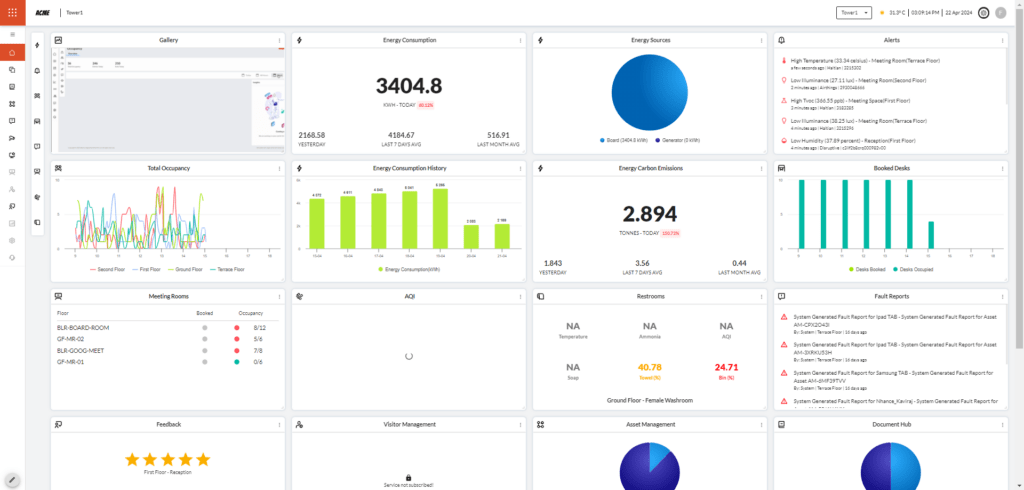
The dashboard fundamentally consists of 4 components. They are as follows –

1. Top Panel –

1.1 The Top Panel displays information about the company and the property currently being looked at along with its brand logo to the left, beside the Navigation button.

1.2 To the right, you can find the account settings where resetting the password or logging out is possible.

1.3 Users can also click the icon to switch between the dark and light modes.

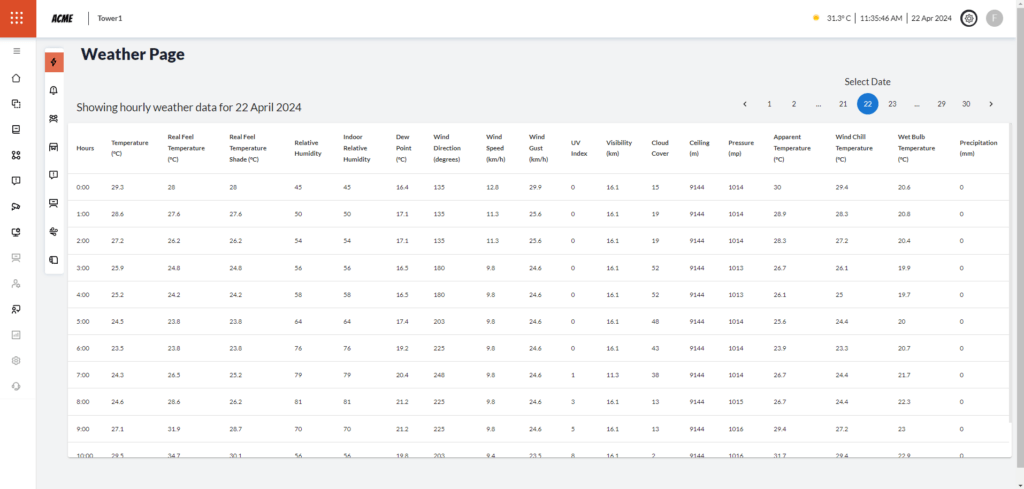
1.4  To its left, information such as weather, date/time, etc are displayed, as seen here –
Clicking on the weather information leads to a more detailed overview of the weather.

Weather Page

1.5 There’s a dropdown to the left of the weather component that allows switching between multiple properties. This determines the data of the property to be displayed.

1.6 The Navigation button allows flipping between Admin Console and Digital Twin modes.

1.6.1 Admin Console: The Admin Console provides access to various admin-only features such as User Management, managing Departments, Categories, Groups, and Areas, and the attendance of all employees.

1.6.2 Digital Twin: This is the default option that leads to the dashboard.

2. Left Panel – 

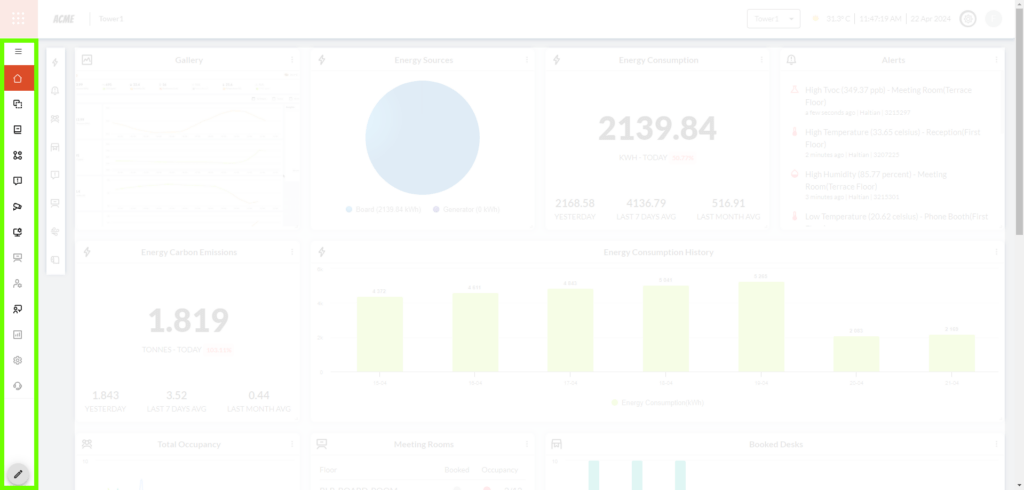
2.1 The Left Panel also known as the Main Menu, has various items listed to navigate to. 

Left Panel

2.2 Hovering over each of the icons in the Left Panel reveals what they do, in a tooltip.

2.3 The sub-menu changes for each item in the Menu.

2.4 Clicking on the Hamburger menu icon expands the Menu.

2.5 Following are the items featured in the Menu bar (Left panel) –

2.5.1 Home: Clicking on Home takes you to the dashboard.

Home

2.5.2 Digital Twin: Clicking on Digital Twin takes you to the 3 different modes of Visualising the space/property, a.k.a. A Digital Twin.

Digital Twin

The 3 modes of visualization are as follows –

2.5.2.1 Autodesk Forge – Visualize the BIM (Building Information Modeling) model of the property/space (and data) in 3D.

2.5.2.2 Matterport – Visualize the property/space (and data) in 3D via 360° captures.

2.5.2.3 Unreal Twin – Visualize the property/space (and data) in 3D making use of Unreal Engine’s powerful rendering and networking capabilities.

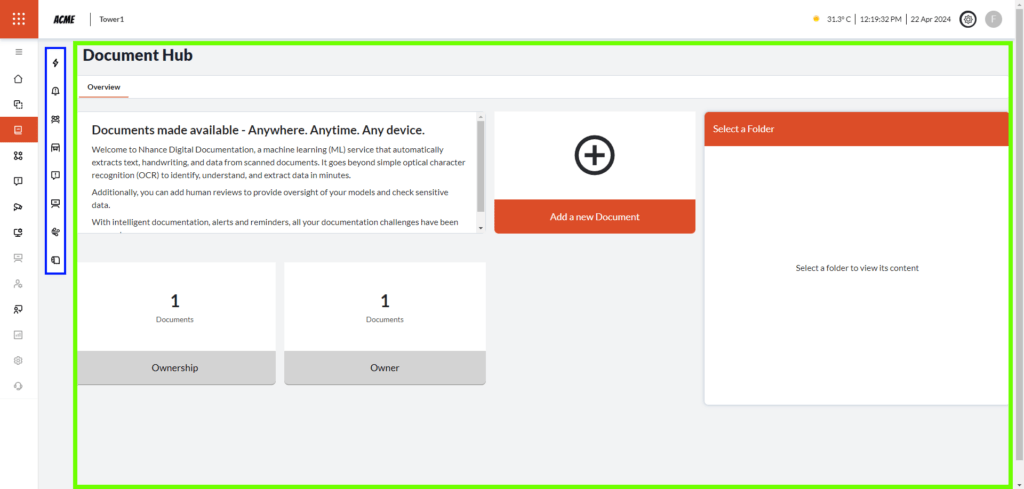
2.5.3 Document Hub – The Document Hub is a place where all documents pertaining to the property are uploaded and managed.

Document Hub

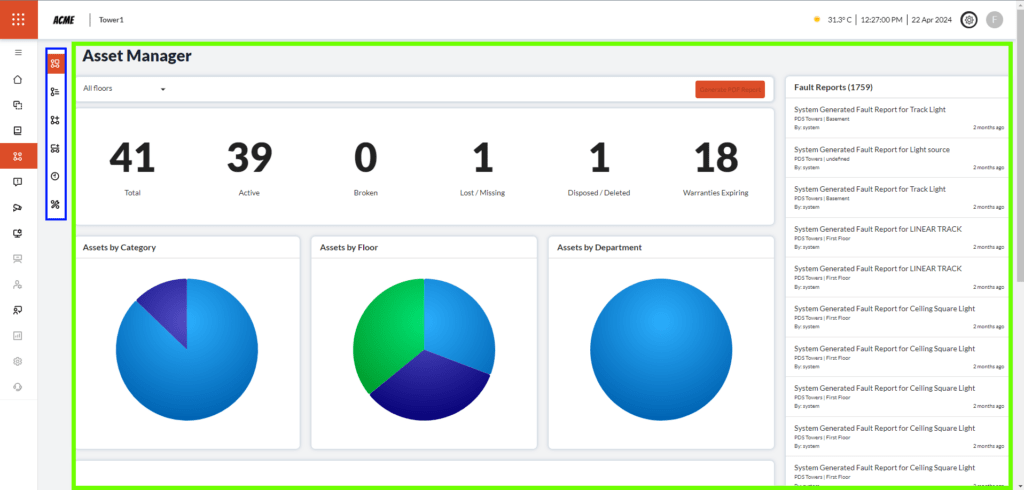
2.5.4 Asset Manager – The Asset Manager is a place where all assets in the office space are managed along with any and all faults reported with respect to any asset.

The Asset Manager has the following sub-menus: (marked in a blue box).

  • Asset List
  • Add an Asset (Form)
  • Add an Asset using a template (Excel)
  • Assets Expiring Warranty
  • Assets that need maintenance
Asset Manager

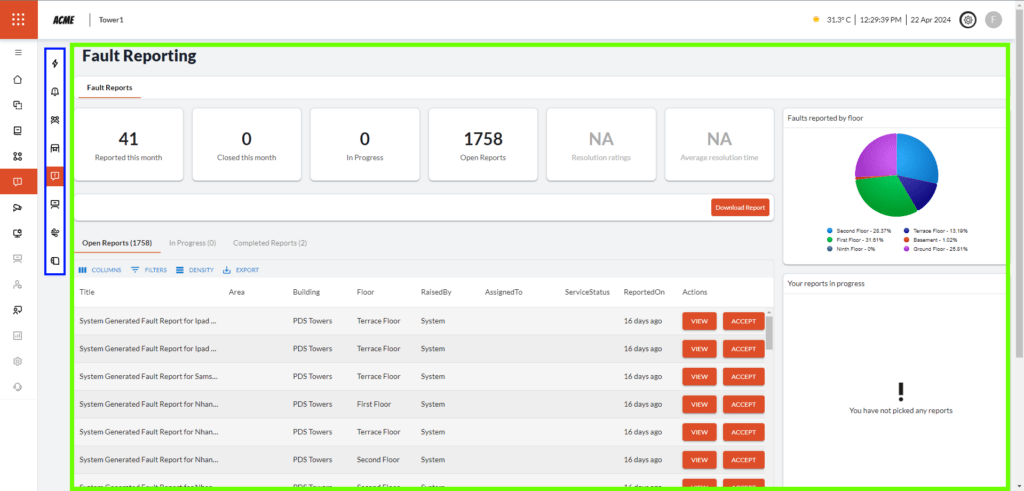
2.5.5 Fault Reporting – Fault Reporting is a place where all faults reported pertaining to the assets are managed. You can also download fault reports of the assets, for a specific time period.

Fault Reporting

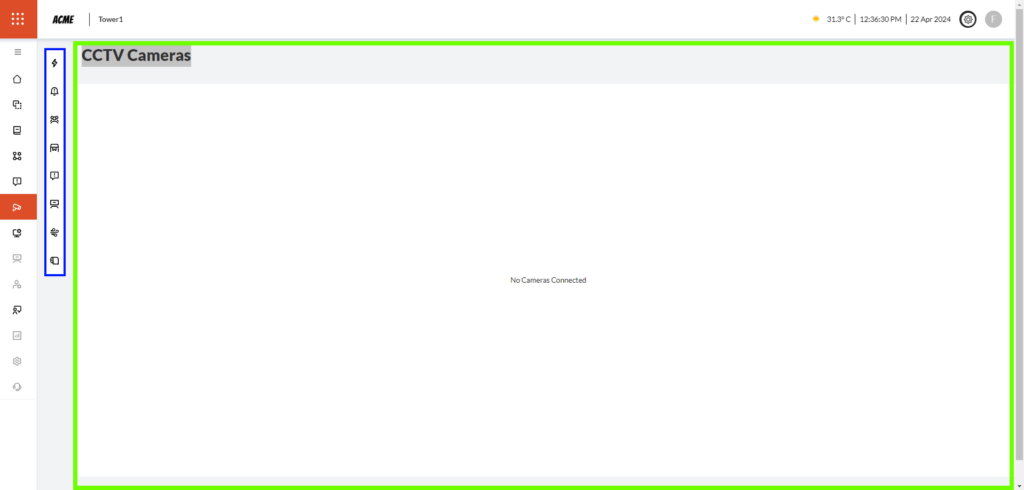
2.5.6 Security – The Security page helps monitor the office space to improve security.

Security

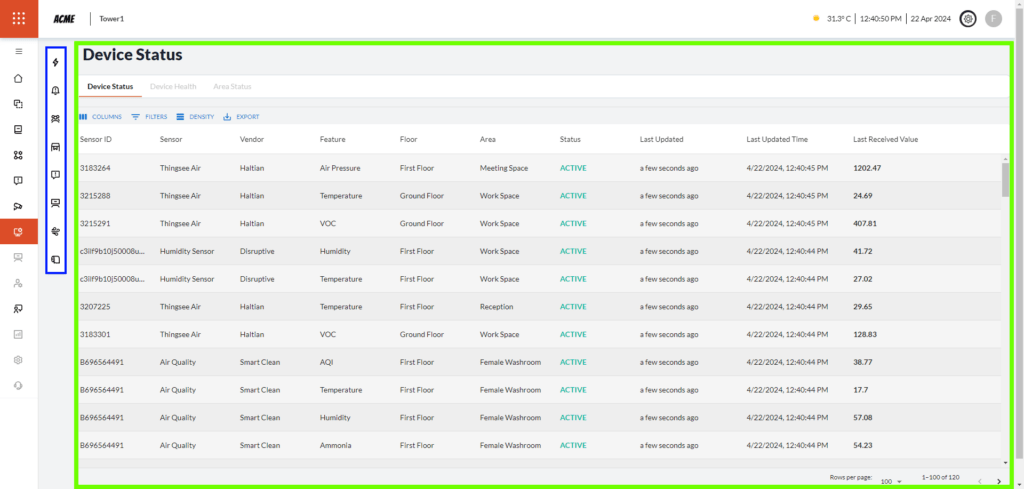
2.5.7 Device Management – The Device Management page helps monitor all onboarded sensors in the office space.

Device Management

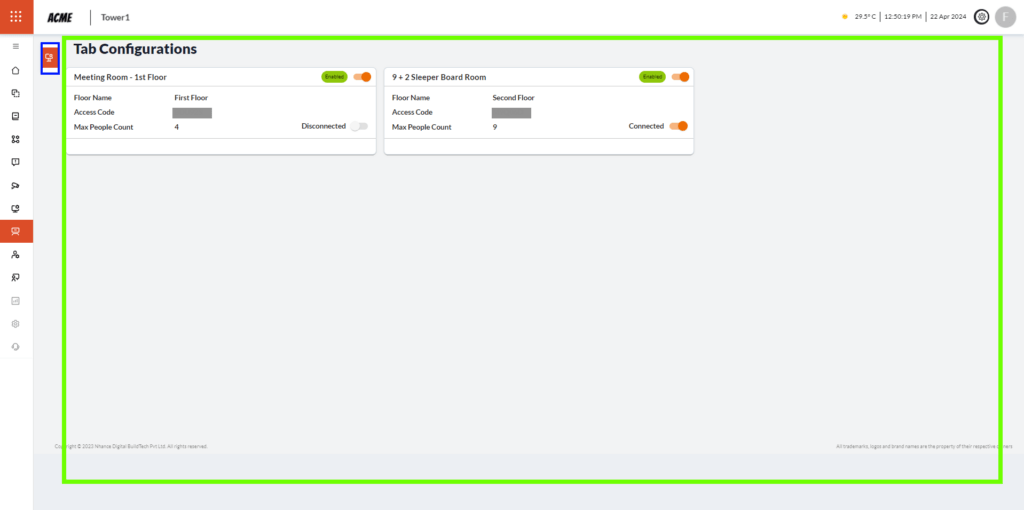
2.5.8 Meeting Rooms – The Meeting Rooms page provides access to tab configurations installed for meeting rooms.

These access codes are used in the Kiosks to link to the dashboard.

Meeting Rooms

2.5.9 Visitor Management – The Visitor Management page provides access to and manage kiosk configurations for visitors.

Visitor Management provides access to the following features:

  • Kiosk Configurations
  • Appointments
  • Visitor Profiles
Visitor Management

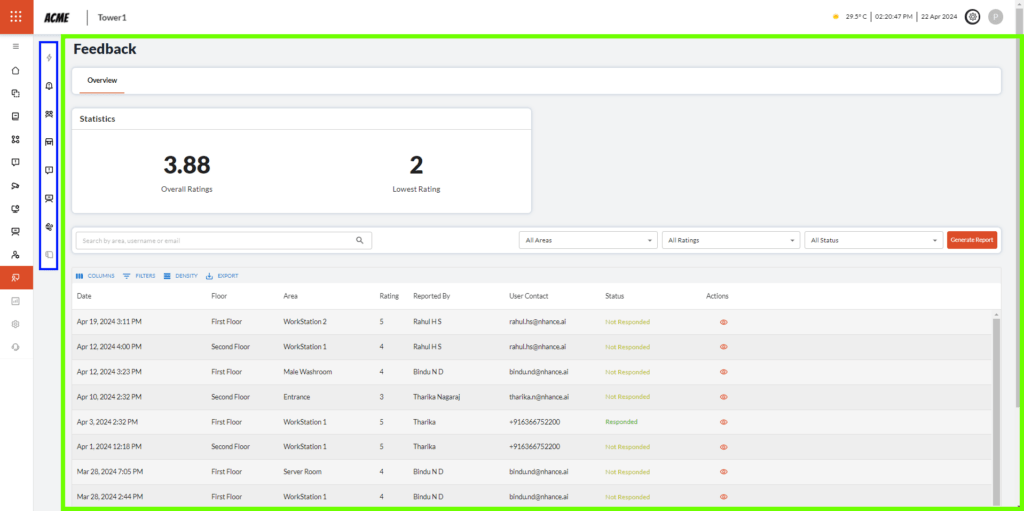
2.5.10 Feedback – The Feedback page allows monitoring feedback provided to areas and spaces in the office, through the mobile app.

Feedback

2.5.11 Analytics and Reporting – Provides analytical reports on obtained data to provide actionable insights. 

2.5.12 Settings – Allows changing basic dashboard settings, and account and billing information.
Settings

2.5.13 Support – Any queries related to the dashboard and the platform can be reported via the support section by clicking on Support.
Support

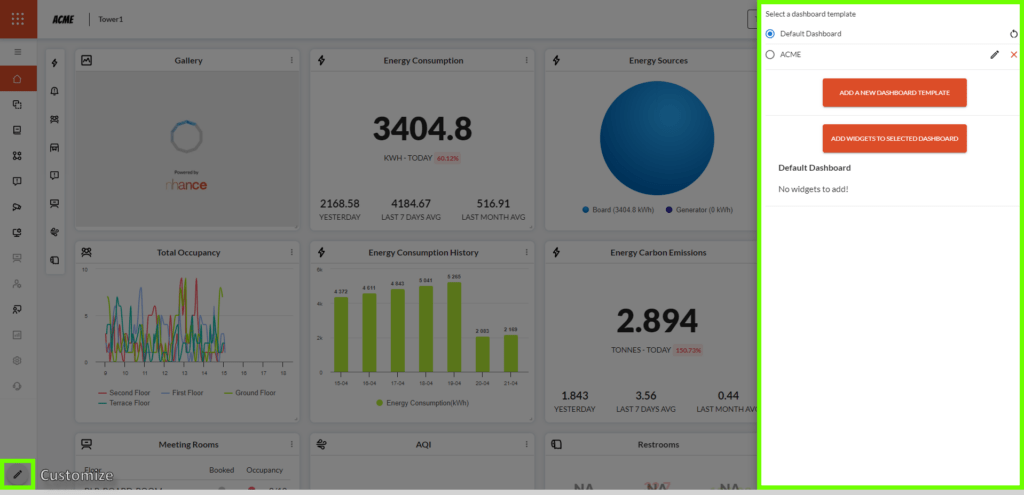
2.5.14 Customize- The dashboard allows you to customize the dashboard and manage templates from a customization menu. This menu also allows adding or removing widgets from the dashboard and saving them as templates. 

You can also reset the dashboard to its defaults if required.

Customize

3.3 Each of the widgets have 2 options in their kebab menu (marked in green):

3. Widgets and Components – 

3.1 The dashboard consists of multiple widgets displaying information on the various components of the twin.

Widgets and Components

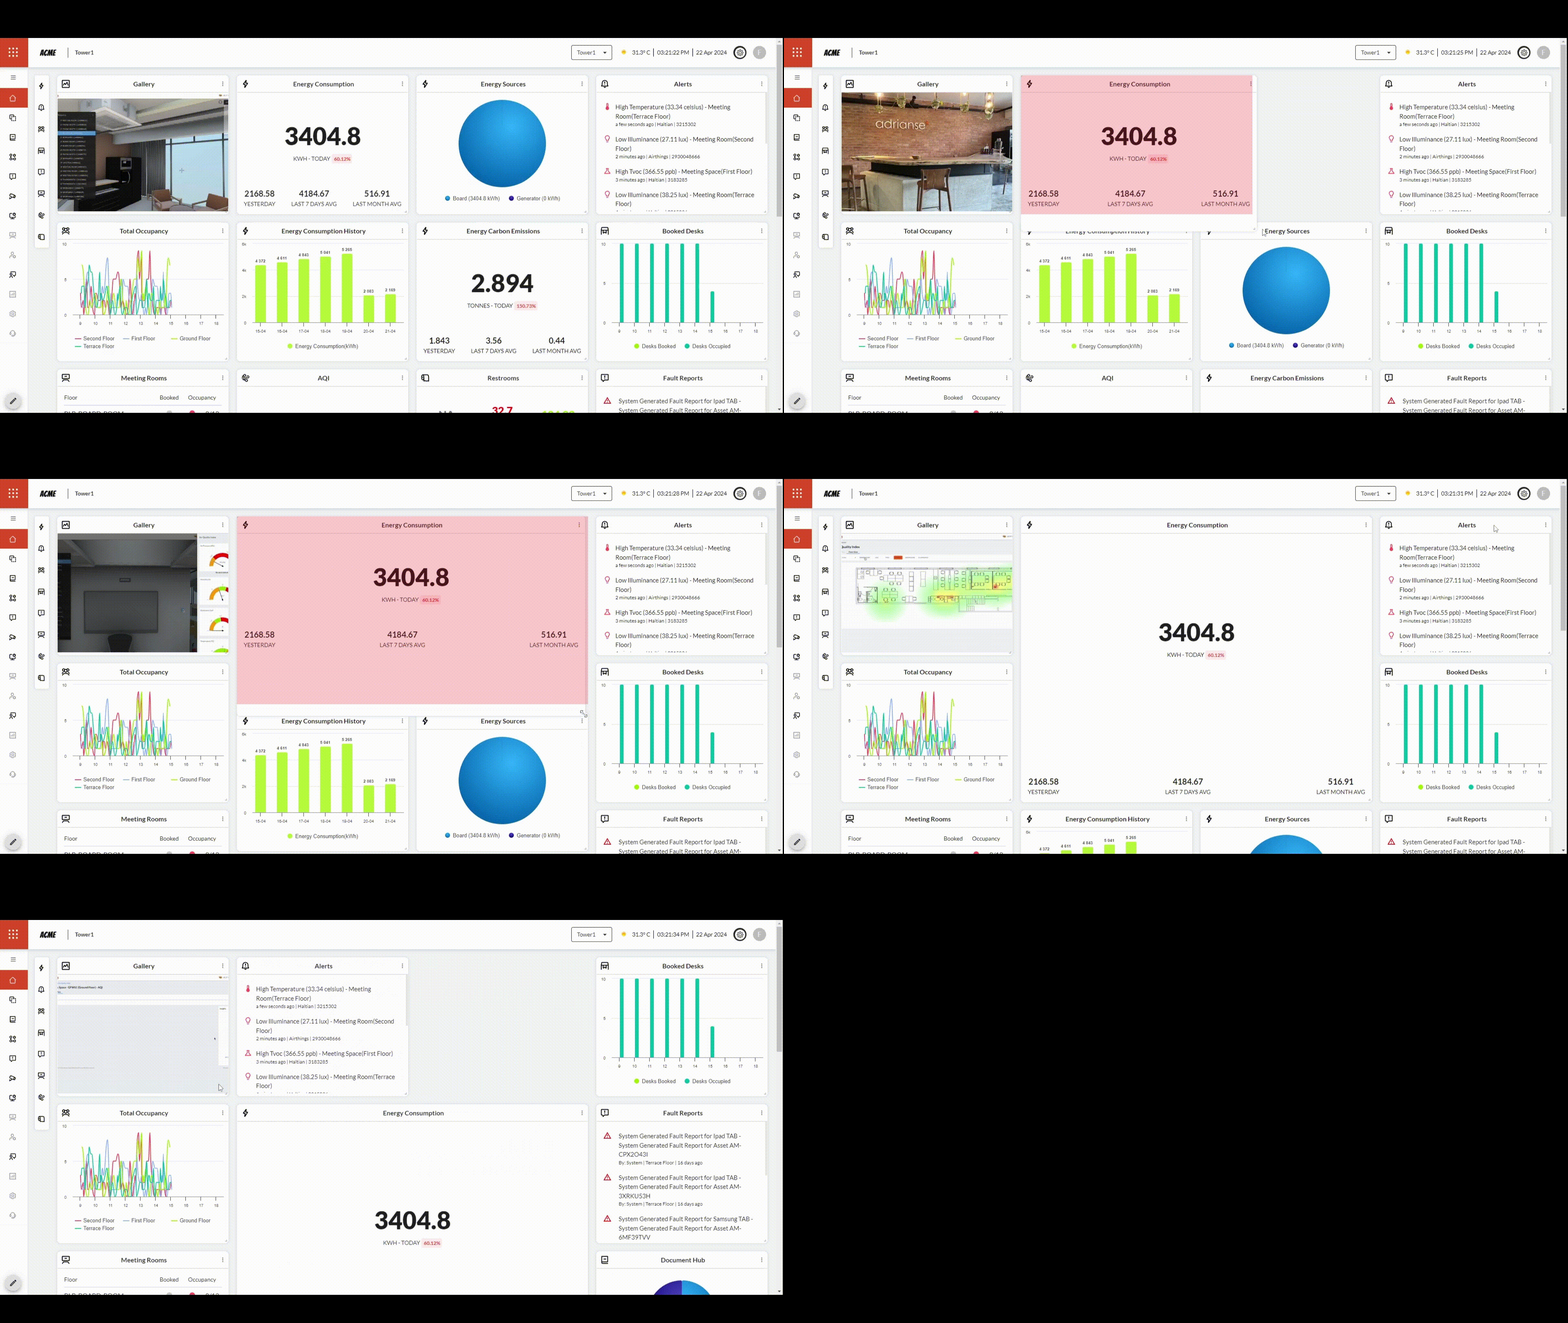
3.2 Each of the widgets can be resized by clicking on the diagonal arrow at the bottom-right corner of the widget and dragging the mouse to wherever required.

The widgets can also be moved by clicking on the title bar of the widget and dragging them around.

Note: The widgets can be reset by resetting the current dashboard in the Customize menu.

widgets

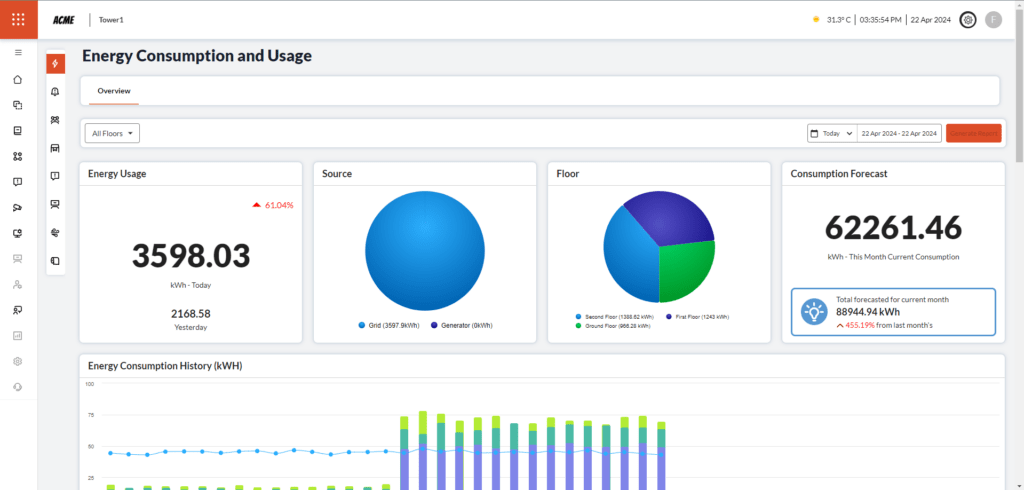
3.3.1 Detailed view: Clicking on the Detailed View takes you to a more detailed view of that component, like in the image below:

3.3.2 Remove grid: Clicking on the Remove grid option removes the component from the dashboard. It can be revived back by resetting the dashboard or adding new widgets in the Customize menu.

4. Components in detail :

4.1 Energy: The Energy component is divided into 4 parts:

4.1.1 Energy Consumption: Provides an overview of the energy consumed on a particular day, the previous day, the average consumption for the last 7 days, and the last month.

The numbers in red indicate an increase in consumption today over yesterday.

4.1.2 Energy Sources: Provides an overview of all the sources the energy is being consumed from.

Energy Sources

4.1.3 Energy Consumption History: Provides an overview of all the sources the energy is being consumed from.

Energy Consumption History

The x-axis represents the date and month in the format dd/mm.
The y-axis represents the energy consumed in KWh.

4.1.4 Energy Carbon Emissions: Provides an overview of the emissions produced on that particular day, the previous day, the average usage for the last 7 days, and the last month.

The numbers in red indicate an increase in emissions today over yesterday.
The numbers in green indicate a decrease in emissions today over yesterday.

4.2 Total Occupancy: The Total Occupancy component provides an overview of the current number of occupants in a given building. The component also provides a visual representation of the occupancy over time.

Total Occupancy

The x-axis represents time in hours from 9 am to 6 pm.
The y-axis represents the number of occupants.

4.3 Meeting Room: The Meeting Room component provides an overview of the list of meeting rooms on a floor along with their booked status and current occupancy.

Meeting Room

The booked status turns red if booked and green if not booked.
The occupancy status turns red if the meeting room is occupied and green if not in use.

4.4 Booked Desks: The Booked Desks component provides a visual representation of desks booked and occupied over time.

Booked Desks

The x-axis represents time in hours from 9 am to 6 pm.
The y-axis represents desks booked and occupied.

4.5 Alerts: The Alerts component provides a list of alerts raised by sensors along with their details, as outlined below:

Alerts

An alert consists of what the alert is about, the area the sensor is located in, the time it was raised, and the sensor that raised it.

4.6 Fault Reports: The Fault Reports component provides a list of faults reported by employees, as outlined below:

Fault Reports

A fault consists of the fault’s message and description, the person who reported that fault, the area the fault was meant for, and the time it was reported.

4.7 AQI: The AQI component provides an overview of the various AQI parameters recorded by the sensor in a space/area.

AQI

Values in green represent ideal values/range, while red and yellow represent higher than and lower than specified ranges for those parameters.

4.8 Restrooms: The Restrooms component provides an overview of the various AQI parameters recorded by the sensor in a restroom along with soap, bin, and paper towel status.

Restrooms

Values in green represent ideal values/range, while red and yellow represent higher than and lower than specified ranges for those parameters.

4.9 Asset Management: The Asset Management component provides an overview of all assets and their status.

Asset Management

The highlighted region in the chart represents the number and percentage of electronic items against Rental Assets.

4.10 Document Hub: The Document Hub component provides an overview of all documents uploaded and managed via the Document Hub.

Document Hub

The highlighted region in the chart represents the number and percentage of documents across a specific category.

4.11 Visitor Management: The Visitor Management component provides an overview of visitors and their status for that particular day and the previous day, and the number of visitors that checked in and walked in.

Visitor Management

4.12 CCTV Camera: The CCTV Cameras component provides an overview of the total number of cameras and their active status.

CCTV Camera

4.13 Sensor(IOT) Alerts: The Sensor(IOT) Alerts component provides an overview of the total number of sensors in the property and their active status.

Sensor(IOT) Alerts

4.14 Feedback: The Feedback component provides insight into feedback provided for the various office spaces in the property/building.

Feedback
Visited 191 times, 1 visit(s) today

Comments are closed.

Close Search Window